November 2025 Market Snapshot

Monthly Overview
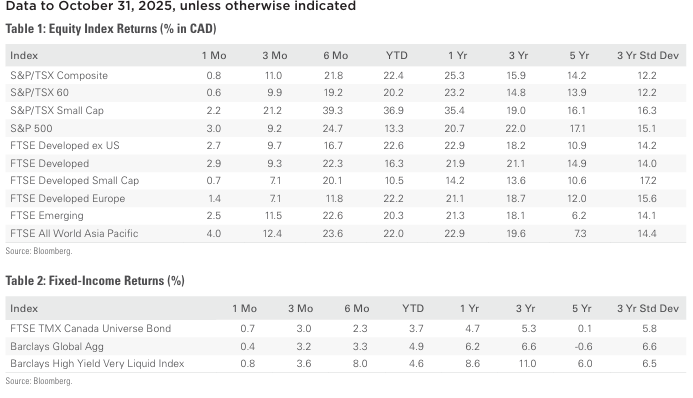
Canadian and U.S. equity markets had another positive month in October. Canada’s benchmark stock index (S&P/TSX Composite Index) marked its sixth straight monthly advance, the longest such streak since 2021. U.S. equities hit record highs in October amid easing U.S.-China trade tensions, an interest-rate cut by the U.S. Federal Reserve (the Fed), robust corporate earnings, and an ongoing government shutdown. The S&P 500 Index recorded its sixth consecutive monthly gain, while the Nasdaq Composite extended its streak to seven.
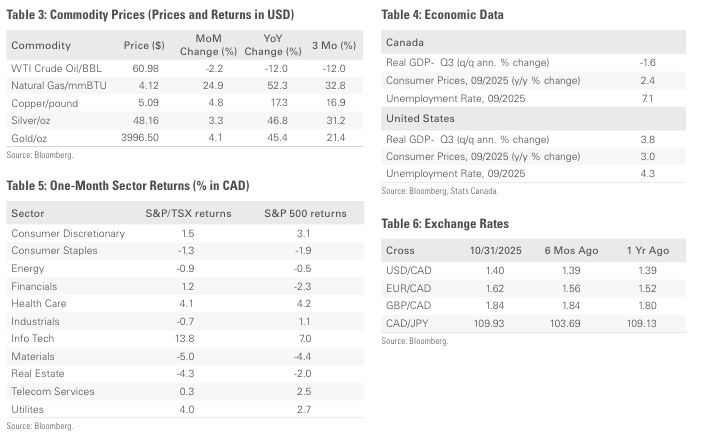
The S&P/TSX Composite was 0.8% higher in October, as six underlying sectors were positive during the month. The gain was led by information technology, rising 13.8%. Small-cap stocks, as measured by the S&P/TSX Small Cap Index, rose 2.2% for the month.
The U.S. dollar appreciated 0.7% versus the loonie in October, boosting the returns of foreign markets from a Canadian investor’s standpoint. U.S.-based stocks, as measured by the S&P 500, gained 3.0% in October (all returns referenced in this paragraph are in Canadian-dollar terms). Six of the benchmark’s underlying sectors were in the green during the month, with information technology leading the gain with a 7.0% return. International stocks, as measured by the FTSE Developed ex-US Index, was up 2.7% during the month, while emerging markets equities rose 2.5%.
The investment-grade fixed-income indices that we follow were positive in October. Canadian investment-grade bonds, as measured by the FTSE Canada Universe Bond Index, gained 0.7% during the month, while the key global investmentgrade bond benchmark rose 0.4%. Global high-yield issues gained 0.8%.
Turning to commodities, natural gas prices surged 24.9% during the month, while the price of a barrel of crude oil lost 2.2%. Gold, silver and copper all had a positive month, gaining 4.1%, 3.3% and 4.8%, respectively.
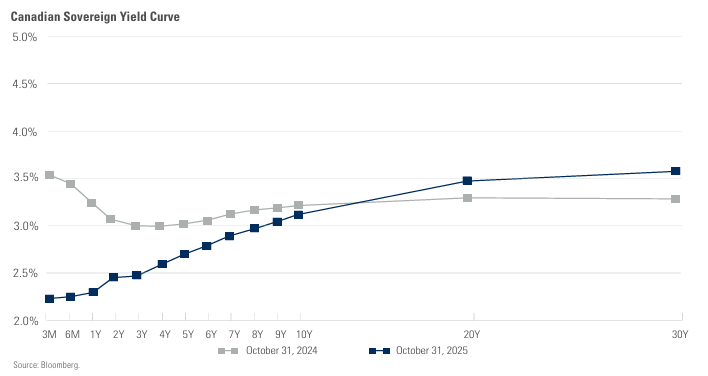
Inflation in Canada came in at 2.4% year-over-year in September, up from the 1.9% print in August. The Canadian economy added 60,000 jobs in September, and the nation’s unemployment held steady at 7.1%. Job gains were concentrated in manufacturing, health care and social assistance, and agriculture. Statistics Canada reported that real GDP fell 0.3% in August, marking a potential stall in third-quarter growth. The decline was driven by a 0.6% drop in the goods-producing industries and a 0.1% dip in the services industries. The Bank of Canada reduced its target for the overnight rate by 25 basis points (bps), to 2.25%, marking the second consecutive cut from the central bank.
In the U.S., the official September 2025 nonfarm payrolls report was not released in light of the federal government shutdown. The consumer price index rose 0.3% in September, putting the 12-month inflation rate at 3.0%. Higher prices at the pump were partly responsible for the sustained strength in headline inflation. In its October meeting, the Fed cut its target federal funds interest rate by 25 bps, to a range of 3.75%-4.00%. The FOMC also announced an end to its “Quantitative Tightening” program as of December 1.
Content sourced from Bloomberg
Chart of the Month
Monthly Market Statistics
This document was prepared by the Investment Products & Platforms Team. The opinions expressed in this document do not necessarily reflect the opinions of iA Private Wealth Inc.
Although the information contained in this document comes from sources, we believe to be reliable, we cannot guarantee its accuracy or completeness. The opinions expressed herein are based on an analysis and interpretation dating from the date of publication and are subject to change without notice. Nothing contained herein constitutes an offer or solicitation to buy or sell any of the securities mentioned. Specific securities discussed are for illustrative purposes only. The information contained herein does not apply to all types of investors. The information provided herein does not constitute financial, tax or legal advice. Always consult with a qualified advisor prior to making any investment decisions.
Commissions, trailing commissions, management fees and expenses all may be associated with mutual fund investments. The indicated rates of return include changes in unit value and reinvestment of all distributions and do not take into account sales, redemption, distribution or optional charges or income taxes payable by any security holder that would have reduced returns. Returns for time periods of more than one year are historical annual compounded returns while returns for time periods of one year or less are cumulative figures and are not annualized. Where applicable, compound growth charts are used only to illustrate the effects of a compound growth rate and are not intended to reflect future values or returns of a fund. A mutual fund’s “yield” refers to income generated by securities held in the fund’s portfolio and does not represent the return of or level of income paid out by the fund. Mutual funds are not guaranteed, their values change frequently, and past performance may not be repeated. The information presented herein may not encompass all risks associated with mutual funds. Important information regarding mutual funds may be found in the simplified prospectus. Please read the simplified prospectus for a more detailed discussion on specific risks of investing in mutual funds. To obtain a copy, please contact your Investment Advisor.
iA Clarington Funds are managed by IA Clarington Investments Inc. a wholly owned subsidiary of Industrial Alliance Insurance and Financial Services Inc., a life and health insurance company which operates under the trade name iA Financial Group. iA Private Wealth Inc. is also a wholly owned subsidiary of Industrial Alliance Insurance and Financial Services Inc. iA Private Wealth Inc. is a member of the Canadian Investor Protection Fund and the Canadian Investment Regulatory Organization. iA Private Wealth is a trademark and business name under which iA Private Wealth Inc. operates.
Posted In: Investment AdvisorsPostsMarket Updates