April 2023 Market Snapshot
Monthly Overview
Stocks rose in March, wrapping up a volatile but profitable quarter that saw more rate hikes from central banks and a mini-banking crisis triggered by the failure of Silicon Valley Bank. The S&P/TSX Composite and the S&P 500 posted their second consecutive quarterly gains, while the tech-heavy Nasdaq had its best quarter since 2020. The market got a boost on the last day of March after the Fed’s preferred inflation gauge, Personal Consumption Expenditures, showed a cooler-than-expected increase in prices. Expectations that the Fed is nearing the end of its rate-hiking cycle contributed to a drop in U.S. Treasury yields.
Canada’s benchmark S&P/TSX Composite Index was down 0.6% in March but posted a 3.7% gain for Q1. Ten of the benchmark’s underlying sectors were positive during the quarter, led by information technology with a 26.5% return. The energy sector was the only detractor for the quarter, with a decline of 3.6%. Small-cap stocks, as measured by the S&P/TSX SmallCap Index, gained 3.9% for the quarter.
The U.S. dollar depreciated by 0.3% versus the loonie during the quarter, slightly dampening the returns of foreign markets from a Canadian investor’s standpoint. Note that all returns in this paragraph are in CAD terms. U.S.- based stocks, as measured by the S&P 500 Index, rose 2.8% in March and finished the quarter 7.0% higher. The benchmark’s quarterly gain was led by information technology and telecommunication services, with respective returns of 21.4% and 20.1%. Energy and financials were the main detractors in the quarter, declining by 5.6% and 6.1%, respectively. International stocks, as measured by the FTSE Developed ex US Index, rose 6.8% during the quarter, while emerging markets rose 2.5%.
The investment grade fixed income indices we follow were up in Q1. Canadian investment grade bonds, as measured by the FTSE Canada Universe Bond Index, were up 3.2% during the quarter. The key global investment grade bond benchmark and global high-yield issues were also up 3.0% and 3.8%, respectively.
Turning to commodities, natural gas tumbled 50.5% in the quarter, while the price of a barrel of crude oil shed 5.7%. Gold, copper, and silver all had a positive quarter with respective gains of 7.8%, 7.5%, and 0.5%.
Inflation in Canada was 5.2% year-over-year in February, from 5.9% year-over-year in January – the largest deceleration since April 2020. The deceleration was due to a base year effect, for the second consecutive month. The Canadian economy added 22,000 jobs in February, as the nation’s unemployment rate held steady at 5.0%. After eight consecutive rate hikes, the Bank of Canada held its key interest rate steady at 4.5%.
U.S. nonfarm payrolls rose by 311,000 in February, but the unemployment rate climbed to 3.6%. The consumer price index increased 6.0% year-over-year in February. A drop in energy prices helped keep inflation in check, while shelter costs increased sharply. The Fed announced another 25-basis point interest rate hike in March, making the benchmark rate the highest it’s been since 2007.
Content sourced from Bloomberg; data as at March 31, 2023.
Chart of the Month
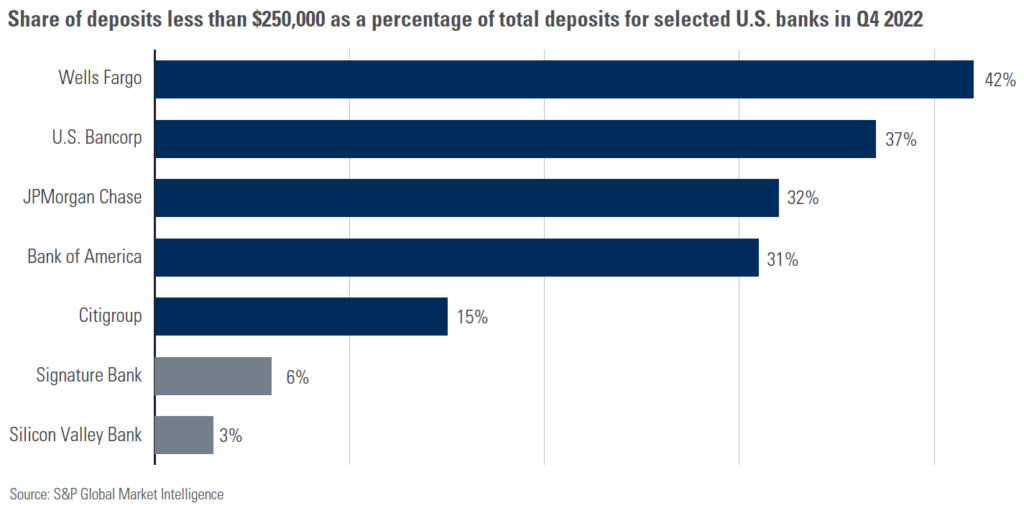
The collapse of Silicon Valley Bank (SVB) and Signature Bank was precipitated by a bank run, which occurs when customers withdraw their funds en masse due to a loss of confidence in the bank. Because SVB and Signature primarily served corporate clients (mainly venture capital startups and crypto companies), most of the deposits exceeded the $250,000 limit that is insured by the Federal Deposit Insurance Corporation (FDIC). Only 3% and 6% of SVB’s and Signature’s total deposits, respectively, were insured by the FDIC. Those figures are a fraction of what you would see at the largest banks in the U.S. Consumers are calling for stricter regulations in the aftermath of the crisis, and higher requirements would raise the cost of doing business for regional banks. Nonetheless, change may be necessary to recover the trust of investors and consumers in the long run.
This document was prepared by the Investment Products & Platforms Team. The opinions expressed in this document do not necessarily reflect the opinions of iA Private Wealth Inc.
Although the information contained in this document comes from sources, we believe to be reliable, we cannot guarantee its accuracy or completeness. The opinions expressed herein are based on an analysis and interpretation dating from the date of publication and are subject to change without notice. Nothing contained herein constitutes an offer or solicitation to buy or sell any of the securities mentioned. Specific securities discussed are for illustrative purposes only. The information contained herein does not apply to all types of investors. The information provided herein does not constitute financial, tax or legal advice. Always consult with a qualified advisor prior to making any investment decisions.
Commissions, trailing commissions, management fees and expenses all may be associated with mutual fund investments. The indicated rates of return include changes in unit value and reinvestment of all distributions and do not take into account sales, redemption, distribution or optional charges or income taxes payable by any security holder that would have reduced returns. Returns for time periods of more than one year are historical annual compounded returns while returns for time periods of one year or less are cumulative figures and are not annualized. Where applicable, compound growth charts are used only to illustrate the effects of a compound growth rate and are not intended to reflect future values or returns of a fund. A mutual fund’s “yield” refers to income generated by securities held in the fund’s portfolio and does not represent the return of or level of income paid out by the fund. Mutual funds are not guaranteed, their values change frequently, and past performance may not be repeated. The information presented herein may not encompass all risks associated with mutual funds. Important information regarding mutual funds may be found in the simplified prospectus. Please read the simplified prospectus for a more detailed discussion on specific risks of investing in mutual funds. To obtain a copy, please contact your Investment Advisor.
iA Clarington Funds are managed by IA Clarington Investments Inc. a wholly owned subsidiary of Industrial Alliance Insurance and Financial Services Inc., a life and health insurance company which operates under the trade name iA Financial Group. iA Private Wealth Inc. is also a wholly owned subsidiary of Industrial Alliance Insurance and Financial Services Inc.
iA Private Wealth Inc. is a member of the Canadian Investor Protection Fund and the Investment Industry Regulatory Organization of Canada. iA Private Wealth is a trademark and business name under which iA Private Wealth Inc. operates.
Posted In: PostsMarket Updates