February 2024 Market Snapshot

Monthly Overview
Stocks started the year off strongly, building on the gains seen in November and December. The Canadian equity market ended the month higher, while the S&P 500 and the Dow Jones Industrial Average achieved new all-time highs in January. Technology stocks rallied, which pushed the tech-heavy Nasdaq Composite and Nasdaq 100 indices higher. The decision by the Bank of Canada and Federal Reserve to keep their benchmark rates steady in January prompted the markets to reassess the likelihood of rate cuts, with March bets seemingly being ruled out.
Canada’s benchmark S&P/TSX Composite Index was 0.3% higher in January, as seven of its underlying sectors were positive during the month. The information technology sector posted a 6.7% gain for the month, while the telecommunication services and industrials sectors rose by 2.8% and 2.1%, respectively. Small-cap stocks, as measured by the S&P/TSX SmallCap Index, were down 0.5% for the month.
The U.S. dollar rose by 1.4% versus the loonie during the month, boosting returns of foreign markets from a Canadian investor’s standpoint. Note that all returns in this paragraph are in CAD terms. U.S.-based stocks, as measured by the S&P 500 Index, rose 3.0% in January. Seven of the underlying sectors were in the green for the month, with the telecommunication services and information technology sectors as the leading contributors, gaining 6.3% and 5.4%, respectively. International stocks, as measured by the FTSE Developed ex-US Index, rose 1.2% during the month, while emerging markets fell 2.3%.
The investment grade fixed income indices we follow were down in January. Canadian investment grade bonds, as measured by the FTSE Canada Universe Bond Index, fell 1.4% during the month, while the key global investment grade bond benchmark and global high-yield issues were down 1.4% and 0.2%, respectively.
Turning to commodities, natural gas prices fell 16.5% during the month, while the price of a barrel of crude oil rose 5.9%. Copper prices rose 0.4%, while silver and gold fell 3.8% and 1.1%, respectively.
Inflation in Canada rose to 3.4% year-over-year in December, led by an acceleration in transportation and shelter costs. The Canadian economy added 100 jobs in December, as the nation’s unemployment rate held steady at 5.8%. The Bank of Canada’s key interest rate remained steady at 5% in January.
U.S. nonfarm payrolls increased by 216,000 in December, as the unemployment rate held steady at 3.7%. The consumer price index rose to 3.4% year-over-year in December. The U.S. personal consumption expenditures price index increased 0.2% month-over-month in December. The U.S. economy expanded an annualized 3.3% in Q4 2023. The federal funds rate was unchanged in January at a target range of 5.25% to 5.5%.
Content sourced from Bloomberg; as at January 31, 2024.
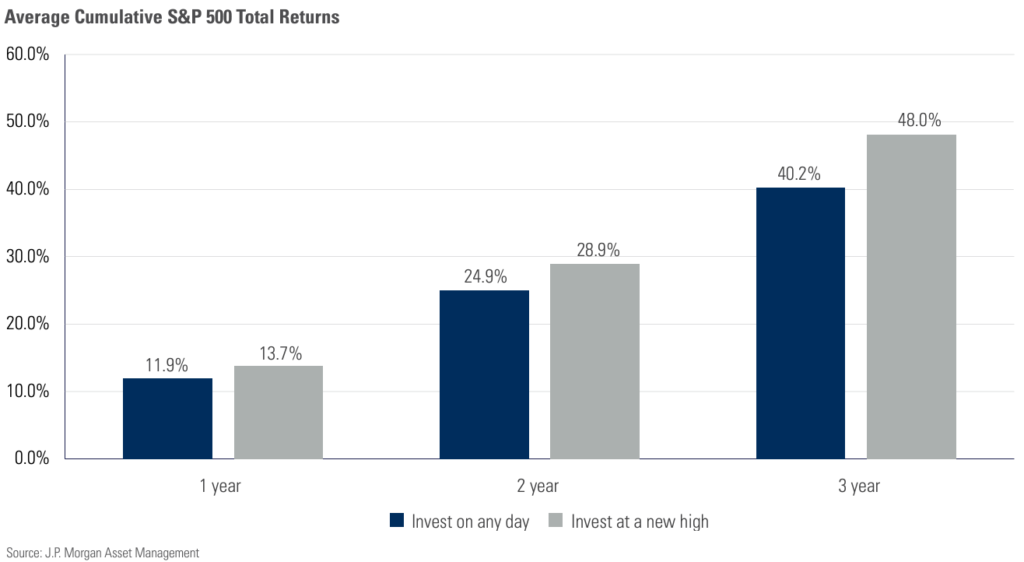
Chart of the Month: Buy the Dips…and the Peaks?
The S&P 500 notched its first all-time closing high in over two years on January 19, and the benchmark would go on to establish five more closing highs before month’s end. Psychologically speaking, some investors can have a tough time getting their heads around investing when the market is higher than it’s ever been. Things can feel “toppy.” It’s uncharted territory. There is no sense that a bargain is being had. But the reality is that the S&P 500 and most broad-based stock indexes have gone up a lot over time, and history has shown us that all-time highs beget new all-time highs. The Chart of the Month compares average index returns over one-, three- and five-year periods using data going back to 1988 to returns over those same periods measured only after new highs for the market were reached. The numbers reveal that a strategy involving investing only at all-time market highs posted better returns than what the market would have done on average. This may be a pretty astounding revelation for some. Ebbs and flows in market performance could cause swings in this comparison over time; however, any notion that exiting the market simply because it reaches a new high could be financially disastrous.
This document was prepared by the Investment Products & Platforms Team. The opinions expressed in this document do not necessarily reflect the opinions of iA Private Wealth Inc.
Although the information contained in this document comes from sources, we believe to be reliable, we cannot guarantee its accuracy or completeness. The opinions expressed herein are based on an analysis and interpretation dating from the date of publication and are subject to change without notice. Nothing contained herein constitutes an offer or solicitation to buy or sell any of the securities mentioned. Specific securities discussed are for illustrative purposes only. The information contained herein does not apply to all types of investors. The information provided herein does not constitute financial, tax or legal advice. Always consult with a qualified advisor prior to making any investment decisions.
Commissions, trailing commissions, management fees and expenses all may be associated with mutual fund investments. The indicated rates of return include changes in unit value and reinvestment of all distributions and do not take into account sales, redemption, distribution or optional charges or income taxes payable by any security holder that would have reduced returns. Returns for time periods of more than one year are historical annual compounded returns while returns for time periods of one year or less are cumulative figures and are not annualized. Where applicable, compound growth charts are used only to illustrate the effects of a compound growth rate and are not intended to reflect future values or returns of a fund. A mutual fund’s “yield” refers to income generated by securities held in the fund’s portfolio and does not represent the return of or level of income paid out by the fund. Mutual funds are not guaranteed, their values change frequently, and past performance may not be repeated. The information presented herein may not encompass all risks associated with mutual funds. Important information regarding mutual funds may be found in the simplified prospectus. Please read the simplified prospectus for a more detailed discussion on specific risks of investing in mutual funds. To obtain a copy, please contact your Investment Advisor.
iA Clarington Funds are managed by IA Clarington Investments Inc. a wholly owned subsidiary of Industrial Alliance Insurance and Financial Services Inc., a life and health insurance company which operates under the trade name iA Financial Group. iA Private Wealth Inc. is also a wholly owned subsidiary of Industrial Alliance Insurance and Financial Services Inc. iA Private Wealth Inc. is a member of the Canadian Investor Protection Fund and the Canadian Investment Regulatory Organization. iA Private Wealth is a trademark and business name under which iA Private Wealth Inc. operates.
Posted In: PostsMarket Updates