September 2025 Market Snapshot

Monthly Overview
Canadian and U.S. equity markets had another strong month in August. The TSX, S&P 500, and Nasdaq extended their winning streaks and set new record highs. In Canada, the main stock index was boosted by gains in gold shares and renewed bets on an interest rate cut by the central bank, following weaker-than-expected GDP data. Similarly, the U.S. equity rally was fueled by dovish signals from the Fed after a weak July jobs report and downward revisions to previous months. Fed officials highlighted growing labour market softness and limited inflation pressures, increasing expectations for multiple rate cuts in 2025.
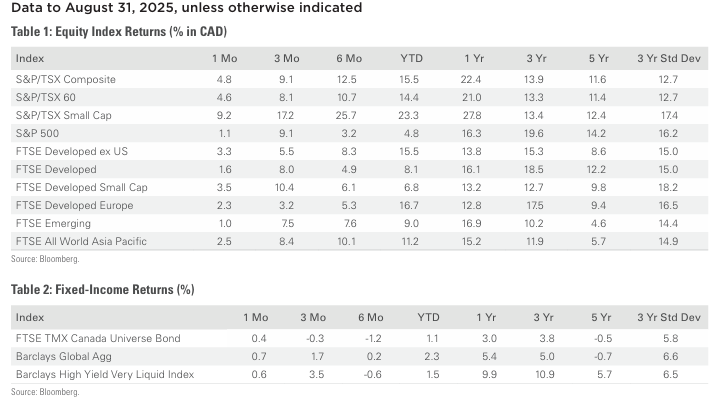
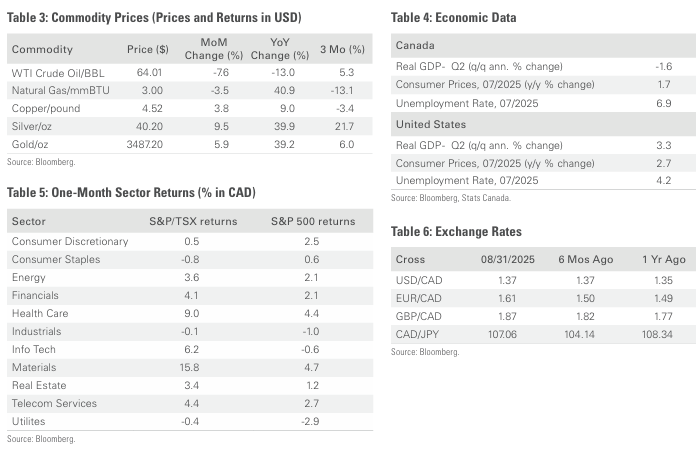
Canada’s benchmark index was 4.8% higher in August, as eight underlying sectors were positive during the month. The gain was led by materials and healthcare, rising 15.8% and 9.0%, respectively. Small-cap stocks, as measured by the S&P/TSX SmallCap Index, rose 9.2% for the month.
The U.S. dollar depreciated 0.8% versus the loonie in August, lowering the returns of foreign markets from a Canadian investor’s standpoint. Note that all returns in this paragraph are in CAD terms. U.S.-based stocks, as measured by the S&P 500 Index, gained 1.1% in August. Eight of the benchmark’s underlying sectors were in the green during the month, with materials leading the gain with a 4.7% return. International stocks, as measured by the FTSE Developed ex-US Index, were up 3.3% during the month, while emerging markets rose 1.0%.
The investment grade fixed income indices we follow were positive in August. Canadian investment grade bonds, as measured by the FTSE Canada Universe Bond Index, gained 0.4% during the month, while the key global investment grade bond benchmark rose 0.7%. Global high-yield issues gained 0.6%.
Turning to commodities, natural gas prices fell 3.5% during the month, while the price of a barrel of crude oil lost 7.6%. Gold, silver, and copper all had a positive month, gaining 5.9%, 9.5%, and 3.8%, respectively.
Inflation in Canada came in at 1.7% year-over-year in July, down from the 1.9% print in June. The decline was due to gasoline prices falling on lower geopolitical tensions and increased OPEC+ output. The Canadian economy lost 41,000 jobs in July, and the nation’s unemployment rate held steady at 6.9%. Younger Canadians continue to face a tough job market, with the unemployment rate at 14.6%, the highest since 2010 (ex-pandemic). Canadian GDP growth slowed sharply in Q2, coming in weaker than expected at -1.6% on an annualized quarter-over-quarter basis, following a strong 2% gain in Q1.
U.S. nonfarm payrolls grew by 73,000 in July, and the unemployment rate held steady at 4.2%. The consumer price index rose 0.2% in July, putting the 12-month inflation rate at 2.7%. The second estimate of Q2 real GDP was revised higher by 0.3 percentage points to 3.3% annualized, which was a sharp acceleration from Q1’s contraction of 0.5%.
Content sourced from Bloomberg
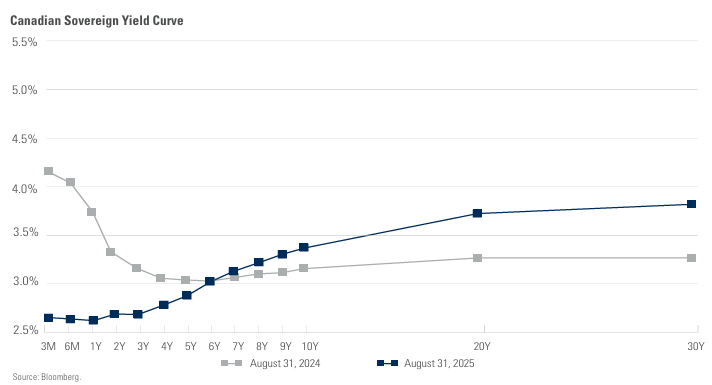
Chart of the Month
Monthly Market Statistics
This document was prepared by the Investment Products & Platforms Team. The opinions expressed in this document do not necessarily reflect the opinions of iA Private Wealth Inc.
Although the information contained in this document comes from sources, we believe to be reliable, we cannot guarantee its accuracy or completeness. The opinions expressed herein are based on an analysis and interpretation dating from the date of publication and are subject to change without notice. Nothing contained herein constitutes an offer or solicitation to buy or sell any of the securities mentioned. Specific securities discussed are for illustrative purposes only. The information contained herein does not apply to all types of investors. The information provided herein does not constitute financial, tax or legal advice. Always consult with a qualified advisor prior to making any investment decisions.
Commissions, trailing commissions, management fees and expenses all may be associated with mutual fund investments. The indicated rates of return include changes in unit value and reinvestment of all distributions and do not take into account sales, redemption, distribution or optional charges or income taxes payable by any security holder that would have reduced returns. Returns for time periods of more than one year are historical annual compounded returns while returns for time periods of one year or less are cumulative figures and are not annualized. Where applicable, compound growth charts are used only to illustrate the effects of a compound growth rate and are not intended to reflect future values or returns of a fund. A mutual fund’s “yield” refers to income generated by securities held in the fund’s portfolio and does not represent the return of or level of income paid out by the fund. Mutual funds are not guaranteed, their values change frequently, and past performance may not be repeated. The information presented herein may not encompass all risks associated with mutual funds. Important information regarding mutual funds may be found in the simplified prospectus. Please read the simplified prospectus for a more detailed discussion on specific risks of investing in mutual funds. To obtain a copy, please contact your Investment Advisor.
iA Clarington Funds are managed by IA Clarington Investments Inc. a wholly owned subsidiary of Industrial Alliance Insurance and Financial Services Inc., a life and health insurance company which operates under the trade name iA Financial Group. iA Private Wealth Inc. is also a wholly owned subsidiary of Industrial Alliance Insurance and Financial Services Inc. iA Private Wealth Inc. is a member of the Canadian Investor Protection Fund and the Canadian Investment Regulatory Organization. iA Private Wealth is a trademark and business name under which iA Private Wealth Inc. operates.
Posted In: Investment AdvisorsPostsMarket Updates